The Atlantic Stays Quiet as Hurricane Season Reaches Its Statistical Peak
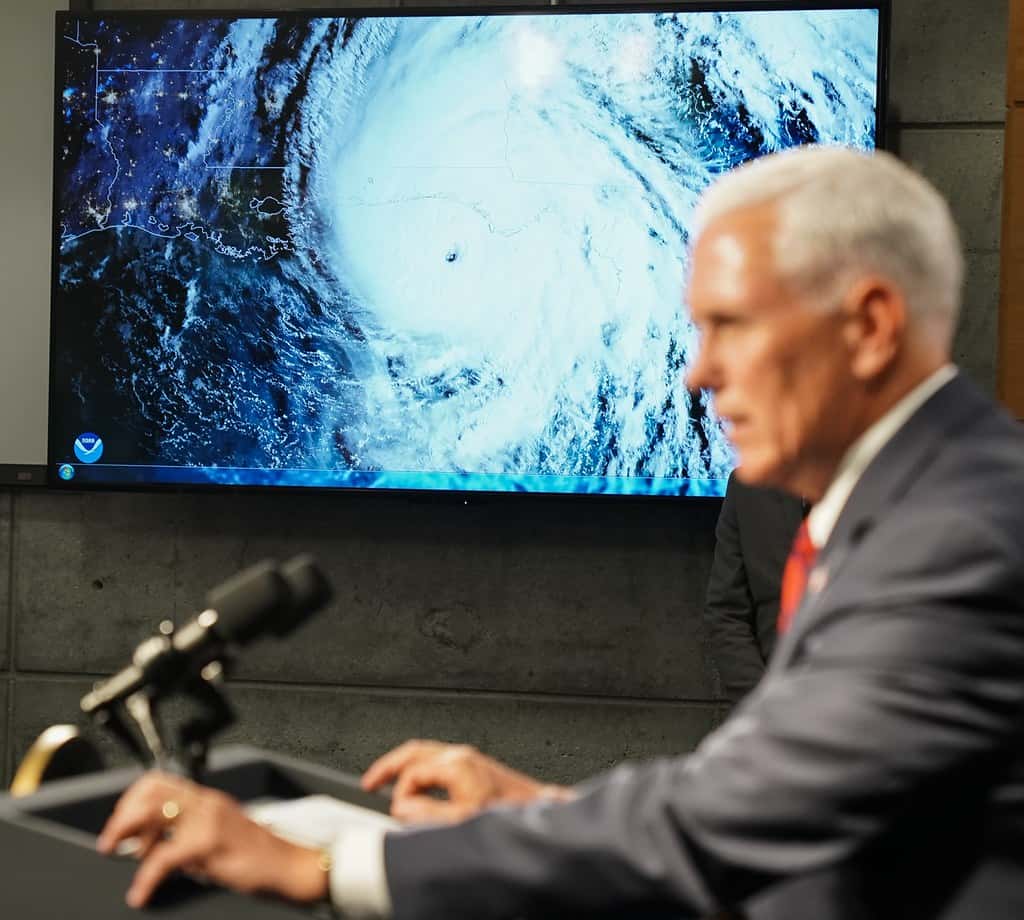
The Atlantic basin has no active tropical cyclones as Florida moves into the stretch of the calendar that historically produces the most hurricane activity. The season has generated two named storms so far, Arthur and Bertha, and no hurricanes, an unusually thin ledger for a season that is nearly three months old.
That pattern is consistent with what federal forecasters projected. NOAA's outlook called for a below normal Atlantic hurricane season, forecasting 7 to 13 named storms, of which 2 to 6 could become hurricanes, including 0 to 2 major hurricanes. The agency assigned a 75 percent probability to below normal activity, 20 percent to near normal and 5 percent to above normal, and it maintained that forecast in its updated outlook.
The quiet is real but the season is not over. The Atlantic hurricane season runs through November 30, and the climatological peak falls in early to mid September. The weeks immediately ahead are, statistically, the most active period of the year.
What the peak means
Atlantic hurricane activity follows a pronounced seasonal curve. Activity builds slowly through June and July, accelerates sharply through August, peaks around September 10, and then declines through October and November. That distribution is driven by ocean heat content, which reaches its annual maximum in late summer, and by atmospheric conditions that become more favorable for development as the season progresses.
The practical consequence is that a season's storm count at mid August says relatively little about its final total. A large share of any season's activity occurs in a roughly six week window centered on early September, and seasons that were quiet through July have on occasion produced significant late season activity.
The reverse is also true. Below normal forecasts have generally verified in recent decades, and the atmospheric and oceanic conditions that produce them tend to persist through a season rather than reversing mid course.
For Florida, none of this is a reason to change preparation behavior. Storm count is a basin wide statistic and has almost no relationship to whether any individual location is affected. A single landfalling hurricane in a season with three named storms produces a worse outcome for the communities in its path than a season with twenty storms that all recurve into the open ocean.
What has happened so far
Arthur and Bertha are the two named storms of the 2026 season. Neither reached hurricane strength, which means the basin has recorded zero hurricanes and zero major hurricanes through mid August.
A season reaching this point without a hurricane is notable but not unprecedented. The first Atlantic hurricane in an average season forms in early to mid August, so 2026 is running behind the climatological norm rather than outside the historical range.
Forecasters have been monitoring tropical waves moving off the African coast, which is the origin of most Atlantic hurricanes during the peak of the season. Whether those waves develop depends on the conditions they encounter as they cross the basin, including wind shear, dry air intrusion from the Saharan Air Layer, and sea surface temperatures along the track.
The National Hurricane Center issues Tropical Weather Outlooks several times daily during the season, assigning formation probabilities over 48 hour and seven day windows to any area of disturbed weather it is monitoring. Those outlooks are the authoritative source for what the basin is actually doing.
Reading the terminology correctly
The distinction between a watch and a warning is the single most consequential piece of hurricane vocabulary, and it is routinely confused. A tropical storm or hurricane watch means conditions are possible within the specified area, generally within 48 hours. A warning means conditions are expected within the area, generally within 36 hours.
The difference in lead time is deliberate. A watch is the signal to complete preparations and to review evacuation plans. A warning means the window for those activities is closing and protective action should already be underway.
Storm surge watches and warnings are issued separately from wind products, because surge and wind hazards do not always align geographically. Storm surge is the leading cause of death in United States hurricanes, and a surge warning can apply to coastal areas outside the zone of the most severe winds.
The cone of uncertainty is another frequently misread product. The cone depicts the probable track of the center of the storm, and it is drawn so that the center stays within it roughly two thirds of the time historically. It says nothing about the size of the storm or the extent of its hazards, and impacts routinely occur far outside the cone.
What it means for Floridians
A quiet August is an opportunity rather than a reprieve. Preparations completed now are preparations not attempted during a warning, when supplies are scarce and roads are congested.
The Florida Division of Emergency Management maintains guidance on supply kits, and the standard recommendation is at least seven days of water at one gallon per person per day, non perishable food, medications, and a plan for pets. Homes running on well water lose supply when power fails, and residents on well systems should plan accordingly.
Knowing an evacuation zone is the single most important piece of local information a coastal Floridian can have. Evacuation zones in Florida are assigned by surge risk, are lettered rather than numbered in most counties, and are published by county emergency management offices. Evacuation orders are issued by zone, which means an order affecting a county does not affect every resident of that county.
Insurance is the preparation that cannot be completed during a storm. Most Florida homeowners policies carry a separate hurricane deductible calculated as a percentage of insured value rather than a flat dollar amount. Flood damage is excluded from standard homeowners policies entirely and requires separate coverage, and new flood policies carry a waiting period before they take effect, typically 30 days.
Local impact across the state
Florida's exposure is not uniform. The Gulf coast from Tampa Bay through the Big Bend has shallow shelf bathymetry that amplifies storm surge, which is why surge forecasts for that stretch of coastline run higher for a given storm intensity than they do elsewhere.
Southwest Florida and the Fort Myers and Naples region carry substantial surge exposure combined with dense coastal development and a housing stock that includes many older structures. South Florida faces both surge and wind risk, with the Atlantic coast from Miami-Dade through Palm Beach exposed to systems approaching from the east.
The Panhandle sits in the Central time zone and is climatologically vulnerable to systems developing in the Gulf, which can offer shorter lead times than Atlantic systems that spend days crossing the basin.
Inland counties are not exempt. Freshwater flooding from rainfall, tornadoes embedded in outer bands, and extended power outages affect areas well removed from the coast, and inland communities frequently receive less pre storm attention than coastal ones despite real exposure.
Why the season has underperformed
Seasonal hurricane forecasts rest on a set of atmospheric and oceanic conditions that can be assessed months in advance. Sea surface temperatures across the main development region of the tropical Atlantic, the state of the El Nino Southern Oscillation, and wind shear patterns are the principal inputs.
El Nino conditions in the Pacific increase wind shear over the Atlantic, which tears developing storms apart before they organize. La Nina conditions have the opposite effect. Sea surface temperatures determine how much energy is available to a storm that does form.
NOAA's below normal outlook for 2026 reflected a combination of those factors, and the season's performance to date is consistent with the forecast. Two named storms and no hurricanes through mid August is at the low end even of a below normal projection, but the season has weeks of peak activity remaining.
Florida's landfall history
Florida has been struck by more hurricanes than any other state, a consequence of its geography: a peninsula extending into warm water with coastline on both the Atlantic and the Gulf.
The state's landfall record includes seasons with multiple strikes and long stretches with none. Between 2005 and 2016 Florida experienced an eleven year period without a hurricane landfall, followed by a sequence of damaging storms including Irma, Michael, Ian, Idalia, Debby, Helene and Milton.
That history is the reason emergency managers resist framing any season as safe. The distribution of landfalls across years is highly uneven, and a quiet basin produces the same outcome as an active one for a community that takes a direct hit.
What a below normal season does not mean
Seasonal outlooks forecast basin wide activity, and they carry no information about where storms will go. A season with three hurricanes that all strike land produces far more damage than a season with fifteen that stay at sea.
Emergency managers consistently emphasize this point because the public tendency is to treat a below normal forecast as a reduced personal risk. It is not. The probability that a specific address is affected in a given year is driven by steering patterns during the weeks a storm exists, which no seasonal forecast addresses.
Several of Florida's most damaging hurricanes occurred in seasons that were not unusually active. The operational guidance from state and federal emergency management does not change based on the seasonal outlook, and residents should not change their preparation based on it either.
What is next
The National Hurricane Center will continue issuing Tropical Weather Outlooks through the peak of the season and into the fall. Any area of interest will appear in those outlooks with a formation probability before it becomes a named system.
September is the month to watch. If the season is going to produce a Florida threat, the climatological odds concentrate it in the next six weeks. October also carries meaningful risk for Florida specifically, because late season systems frequently form in the western Caribbean and track north into the state.
The forecast remains for a below normal season, and it has verified so far. That is a statement about basin wide activity and not a forecast for any location. The preparation guidance does not change based on a seasonal outlook, because the number of storms in the basin has no bearing on whether one of them arrives at a particular address.
Spotted an issue with this article?
Have something to say about this story?
Write a letter to the editor