Royal Caribbean Earnings Test a Cruise Boom Florida's Ports Depend On
Royal Caribbean Group reports second quarter results before the market opens on July 28, giving investors and Florida port officials a fresh read on an industry that anchors a substantial portion of the state's coastal economy. Analysts polled ahead of the release expected the Miami-based company to post a profit of $3.92 per share on a diluted basis, down 10.5 percent from $4.38 in the same quarter a year earlier.
The expected decline sits against a backdrop of industry strength rather than weakness. The Cruise Lines International Association projects global cruise passenger volume will exceed 38 million travelers in 2026, another industry record. Carnival Corporation reported record revenues, yields, adjusted earnings, and customer deposits in its second quarter, with net income exceeding its March guidance by $100 million.
For Florida, the results matter well beyond the stock price. The state's ports handle a dominant share of North American cruise embarkations, and the industry's employment and tax contributions reach across multiple metropolitan areas.
Why Florida is the center of the industry
Three of the world's largest cruise companies maintain headquarters in South Florida. Royal Caribbean Group and Carnival Corporation are based in the Miami area, and Norwegian Cruise Line Holdings also operates from South Florida. That concentration of corporate headquarters is unusual for any global industry and reflects the geographic logic of Caribbean itineraries.
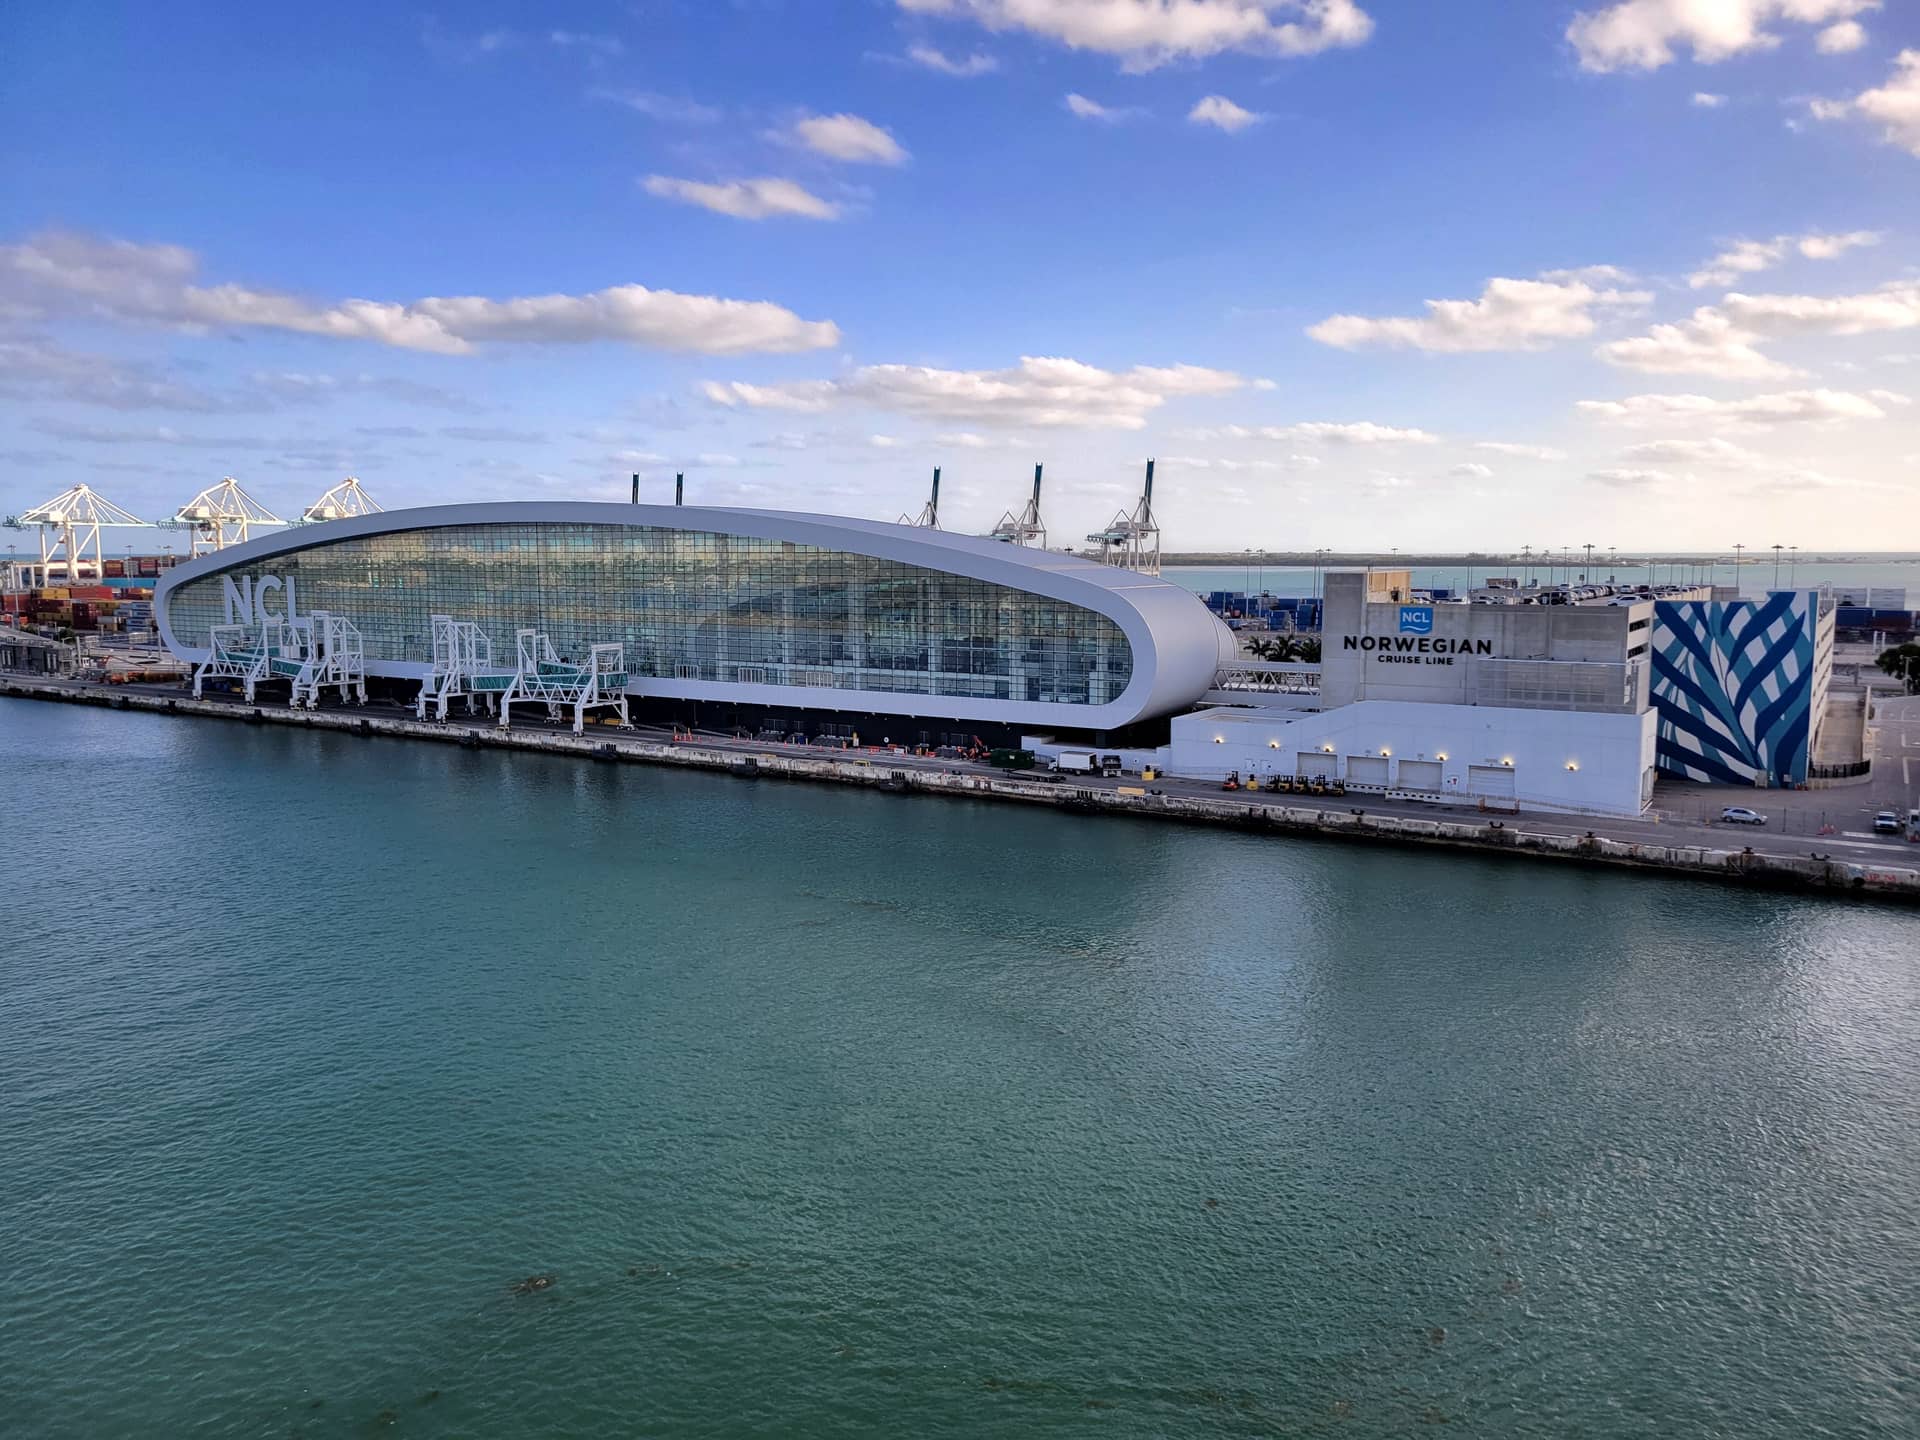
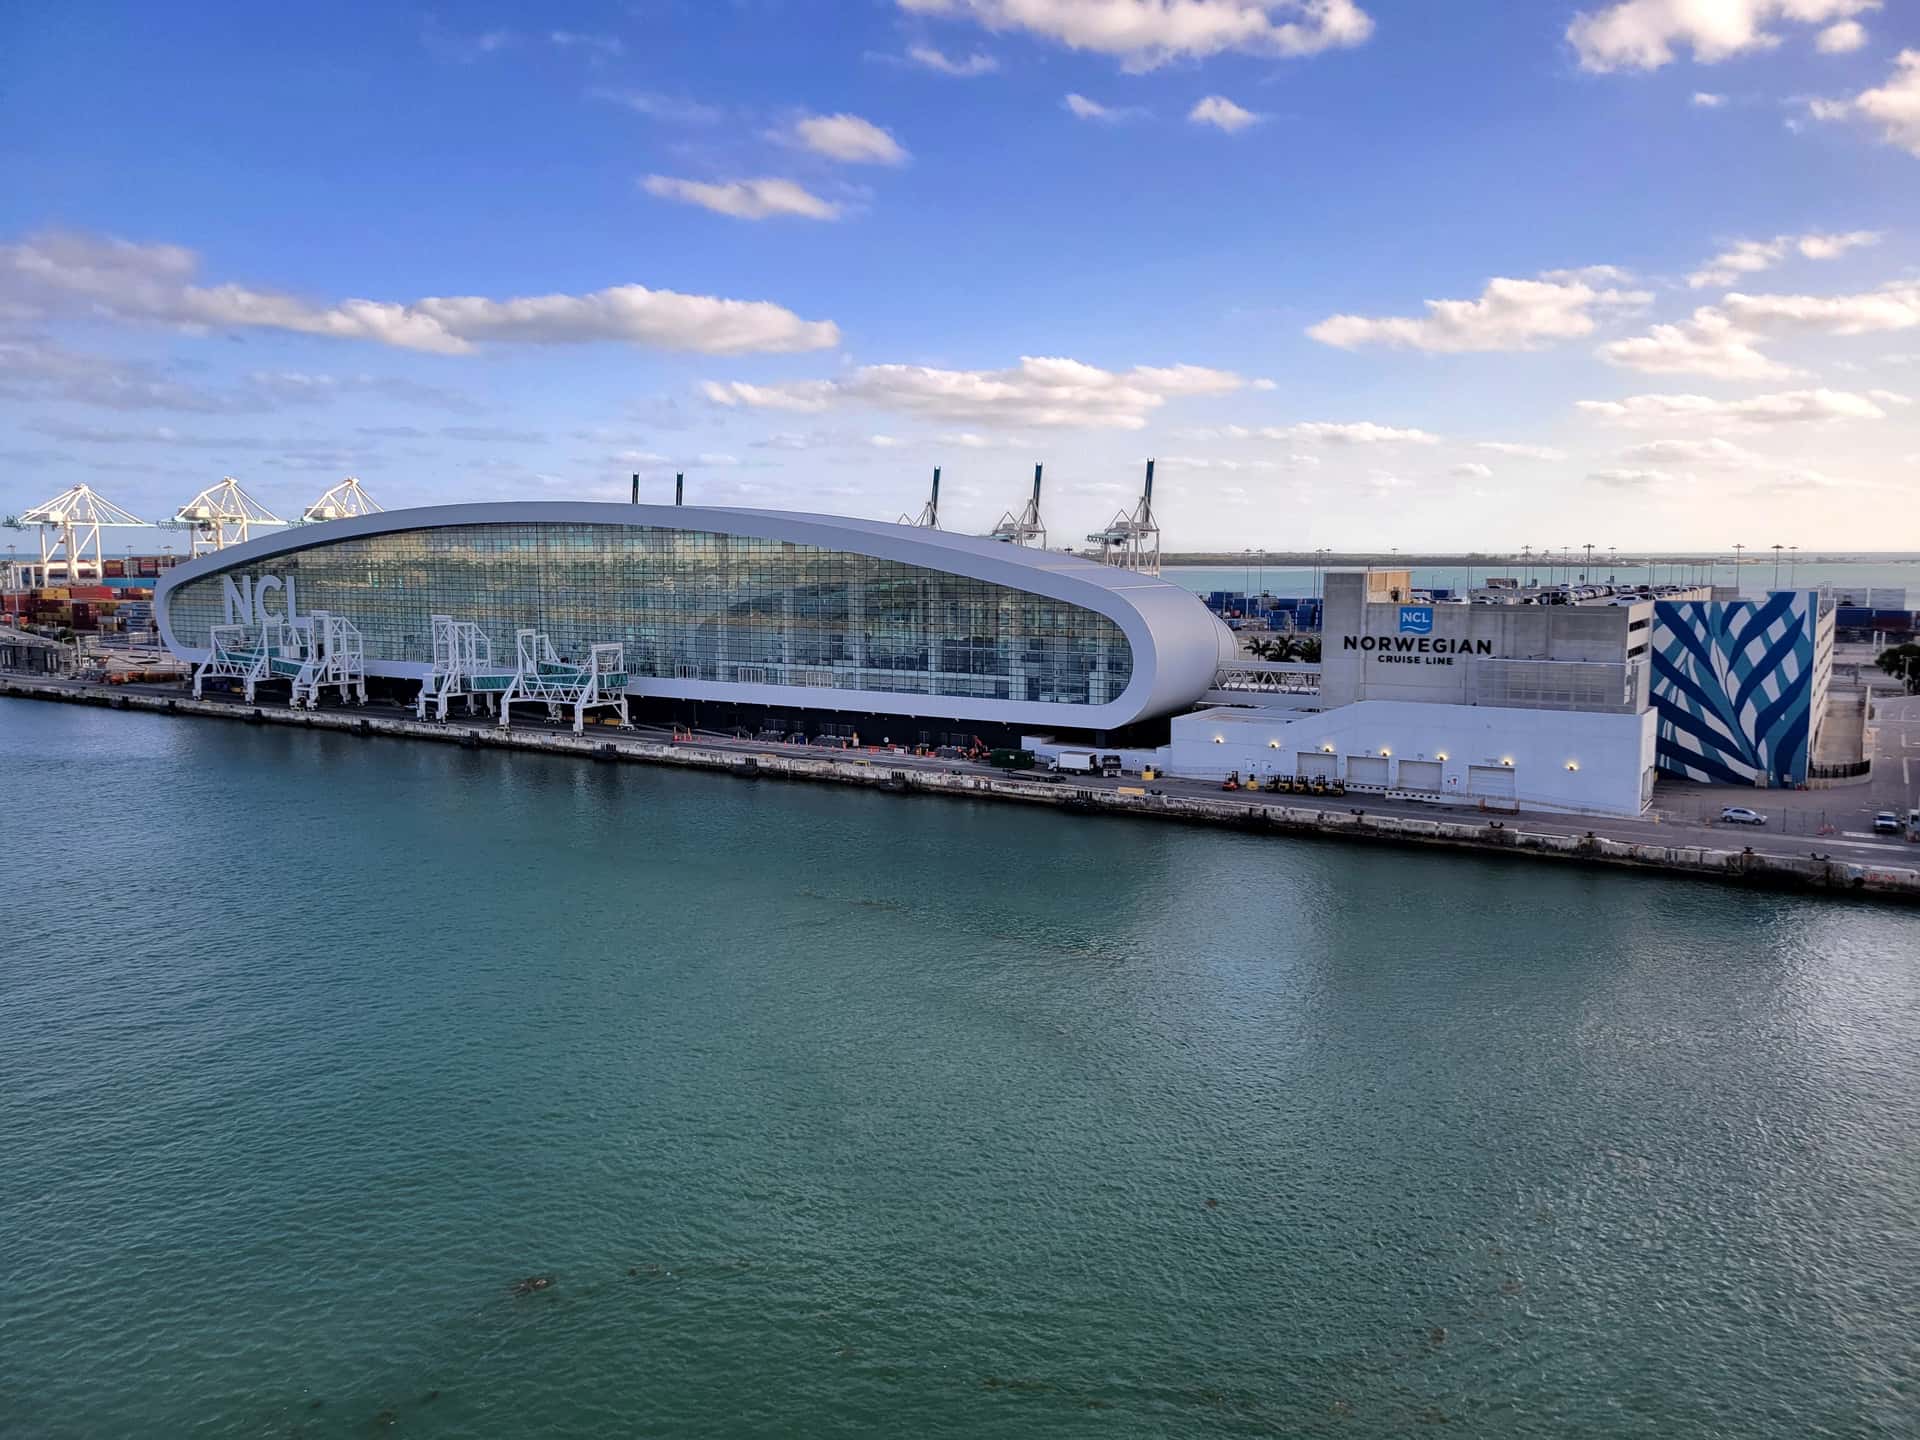
PortMiami has long described itself as the cruise capital of the world based on passenger volume. Port Everglades in Fort Lauderdale, Port Canaveral on the Space Coast, and Port Tampa Bay add substantial capacity, and Jacksonville also handles cruise operations.
The economic footprint extends past the terminals. Cruise operations support port labor, provisioning and supply chains, ship maintenance and repair, fuel, and the travel infrastructure serving passengers who fly into Florida airports and stay in Florida hotels before and after sailing.
Port Canaveral illustrates the multiplier effect. Passengers embarking there frequently combine a cruise with an Orlando theme park visit, meaning cruise volume drives hotel demand and attraction attendance across Central Florida.
What the expected earnings decline reflects
A projected 10.5 percent decline in earnings per share against a record demand environment requires explanation. Cruise economics involve several moving components that can diverge from passenger volume.
Capacity expansion is one factor. The industry has taken delivery of new vessels at a substantial pace, and new ships carry financing costs and depreciation from the moment they enter service while ramping toward full revenue performance. Growth in capacity can pressure per-share metrics even as total revenue rises.
Fuel costs are another. Cruise ships consume large quantities of marine fuel, and energy prices have been rising, a factor also cited in the inflation data that has kept the Federal Reserve cautious about rate cuts. Fuel hedging smooths but does not eliminate this exposure.
Labor, food, and port costs have all risen with general inflation. Cruise lines have offset much of this through pricing power, with higher ticket prices and increased onboard spending supporting some of the strongest margins in leisure travel, but the offset is not always complete in any given quarter.
Royal Caribbean generated approximately $4.54 billion in revenue in the first quarter of 2026 with adjusted earnings of $3.60 per share, a result that reflected the pricing strength the company has maintained.
The demand picture
The projection of more than 38 million global cruise passengers in 2026 continues a growth trajectory that has been sustained since the industry's return to operations following the pandemic shutdown, which was among the most severe disruptions any travel sector experienced.
Several factors support the demand. Cruise pricing has generally remained attractive relative to land-based vacations on an all-inclusive basis. The industry has expanded its demographic reach beyond its traditional older customer base. Private destination development, in which cruise lines operate their own island and beach destinations, has given companies control over a portion of the guest experience and its associated revenue.
Customer deposits, which Carnival reported at record levels, function as a forward indicator. Deposits reflect bookings for future sailings, meaning strength there suggests demand extending beyond the current quarter.
Florida's exposure to the industry
The concentration that makes Florida the industry's center also makes the state's coastal economies exposed to it. Cruise employment includes port workers, terminal staff, corporate headquarters employees, and the extensive supplier network that provisions vessels.
Port revenues fund infrastructure and, in some cases, contribute to local government budgets. Cruise passengers generate sales tax on pre-cruise and post-cruise spending, relevant in a state without an income tax that depends heavily on consumption taxes.
Hurricane season is the recurring operational risk. Storms force itinerary changes, delay embarkations, and can close ports entirely. The industry has developed sophisticated routing capabilities that allow ships to avoid storms, but port closures affect embarkation regardless of where vessels are.
NOAA's outlook for the 2026 Atlantic season called for below-normal activity with 8 to 14 named storms, and the basin has been quiet through July, with the National Hurricane Center indicating on July 27 that no tropical cyclone formation was expected over the following seven days. NOAA updates the outlook in early August ahead of the historical peak.
Regulatory and policy factors
Environmental regulation is an ongoing consideration for an industry operating large vessels in sensitive marine environments. Emissions standards, wastewater discharge rules, and requirements around shore power connections at ports all shape operating costs and capital planning.
Several Florida ports have pursued shore power infrastructure, which allows docked vessels to draw electricity from the grid rather than running engines, reducing local air emissions.
Cuba policy has historically affected itinerary planning for Florida-based cruise operations, and Helms-Burton Act litigation has produced consequential rulings affecting the industry. Cruise lines were the subject of a significant Supreme Court decision concerning liability for use of confiscated Cuban port property.
Labor and consumer protection questions periodically reach Congress, and Florida's congressional delegation has an outsized interest in cruise legislation given the industry's concentration in the state.
What investors and ports will watch
Beyond the headline earnings figure, the elements that carry the most information are forward guidance, booking commentary, and net yield trends, which measure revenue per available berth day after accounting for costs directly tied to passengers.
Guidance for the remainder of 2026 will indicate whether the company sees the demand environment holding through the fall and winter Caribbean season, which is when Florida ports operate at their highest volumes.
Norwegian Cruise Line Holdings reports on July 30, providing a further data point. Carnival reported in June. Together the three sets of results give a reasonably complete picture of the industry's condition.
How cruise economics actually work
Understanding a cruise company's results requires knowing which metrics carry the information, because revenue and passenger counts alone can mislead.
Net yield measures revenue per available passenger cruise day after deducting the costs directly associated with carrying passengers. It is the industry's closest analogue to a same-store sales figure, isolating pricing and onboard spending performance from the effects of adding capacity.
Occupancy in the cruise industry regularly exceeds 100 percent, which confuses observers encountering it for the first time. Capacity is calculated on the basis of two passengers per cabin, so cabins occupied by three or four people push the figure above 100.
Onboard revenue has become an increasingly important component. Beverage packages, shore excursions, specialty dining, spa services, internet access, and casino operations generate substantial margin, and companies have oriented ship design and pricing structures around capturing it.
Customer deposits function as the forward indicator. Because cruises are typically booked months ahead with deposits paid at booking, the deposit balance reflects demand for sailings that have not yet occurred.
What the ports themselves contribute
Florida's cruise ports operate as independent authorities or as county departments, and their finances are distinct from those of the cruise lines that call on them.
Revenue comes from passenger fees, dockage, parking, and terminal leases. Ports invest that revenue in terminal construction, berth capacity, and landside infrastructure, frequently financed through revenue bonds serviced by future passenger volume.
That financing structure means port authorities take on long-term exposure to cruise demand. A terminal built for a projected passenger volume must generate that volume to service its debt, which aligns port interests closely with the industry's growth.
The employment picture at the ports includes longshore labor, terminal operations, security, customs and border protection staffing, and the provisioning operations that load food, beverages, and supplies. A single large vessel turnaround involves the movement of an enormous quantity of goods within a few hours.
Ground transportation adds another layer. Cruise passengers arriving by air move between Florida airports and terminals in volumes that shape regional transportation planning, particularly in Miami-Dade, Broward, and Brevard counties.
The itinerary geography
Florida's dominance rests on geography that cannot be replicated elsewhere in the United States. The Caribbean is within a comfortable sailing distance of Florida ports, which allows the seven-day itineraries that constitute the industry's core product.
Eastern Caribbean itineraries typically serve the Bahamas, St. Thomas, and St. Maarten. Western Caribbean routes reach Mexico, Belize, Honduras, and the Cayman Islands. Southern Caribbean sailings extend further and generally depart from ports closer to the region.
Private destinations have altered this picture substantially. Cruise lines have developed their own islands and beach clubs in the Bahamas and elsewhere, which gives them control over the guest experience, capture of onshore spending, and immunity from the port congestion that affects popular public destinations.
The Bahamas' proximity to Florida makes short three and four-day itineraries viable from Florida ports, a product category that draws a different customer than the seven-day cruise and that has grown as companies have expanded their private destination capacity.
What's next
The Royal Caribbean release and the accompanying call are the immediate events, followed by Norwegian's results on July 30.
For Florida, the operational test comes later. The peak of Atlantic hurricane activity falls from mid-September through October, overlapping with the start of the winter Caribbean booking and sailing season. How the remainder of the season develops will determine whether the industry's Florida operations run smoothly through the fall.
Port expansion projects across Florida continue, with terminal capacity investments proceeding on the expectation that passenger growth will be sustained. Those investments represent long-term bets by port authorities that the demand projections hold.
Spotted an issue with this article?
Have something to say about this story?
Write a letter to the editor