Orlando Theme Park Attendance Softens as Central Florida Tourism Cools

The Orlando theme park market, which anchors Central Florida's economy and generates a substantial share of Florida's tourism tax revenue, has shown signs of an attendance slowdown that operators have now acknowledged publicly. Comcast Co-CEO Mike Cavanagh told analysts during the company's second-quarter earnings call in July that attendance across the Orlando market began softening in June and remained pressured into the third quarter.
The company attributed the weakness to broader conditions rather than to any specific attraction, pointing to weaker consumer sentiment and higher travel costs. Executives said Epic Universe, the Universal Orlando park that opened in 2025, continued to meet expectations and to lift per-capita spending across the destination.
What the operators are saying
The two dominant operators have offered different characterizations of the same quarter, which complicates any clean read of the market. Comcast described softening across the Orlando market broadly. Disney Chief Financial Officer Hugh Johnston said Walt Disney World posted very strong attendance for the quarter and drew a public distinction between Disney's results and those of its competitor.
Both statements can be true simultaneously. Market-wide attendance can decline while one operator gains share, particularly in a year when a major new park has redistributed visitation patterns across the destination. Epic Universe's opening added substantial capacity to the Orlando market, and the addition of capacity into a market with flat or declining total demand produces exactly this pattern.
Notably, Universal executives have not identified their own new park as the source of weakness. The framing from Comcast points outward, toward consumer conditions, which is a more consequential diagnosis for the region than a competitive share shift would be.
Why consumer sentiment matters here
A theme park vacation is among the most discretionary purchases an American household makes. It typically involves airfare or a long drive, multiple nights of lodging, multi-day admission tickets, food and merchandise. The total outlay for a family of four visiting Orlando for a week runs into thousands of dollars.
That structure makes the sector unusually sensitive to household financial conditions. When consumers pull back on discretionary spending, theme park visitation is among the earlier categories to show it, and it typically shows up first as trip deferral rather than cancellation, then as shorter stays and lower in-park spending.
Travel costs are the second variable operators cited. Airfare, hotel rates and rental car pricing all determine the total cost of an Orlando trip well beyond the admission price, and increases in any of them reduce the number of households for whom the trip pencils out.
What it means for Central Florida
Orange and Osceola counties depend on tourism to a degree few American metropolitan areas match. The industry supports employment across attractions, hotels, restaurants, transportation and retail, and it generates tourist development tax revenue that funds convention facilities, sports venues and destination marketing.
Employment is where a sustained attendance decline would register first for residents. Leisure and hospitality is among the largest private employment categories in the region, and hours reduction typically precedes headcount reduction in a softening market. Workers in the sector often feel a slowdown through schedule changes before any layoffs occur.
Statewide, Florida's unemployment rate held at 3.7 percent in July, with private-sector employment adding 5,700 jobs after a sharp June decline. Whether Central Florida's tourism employment tracks that statewide stabilization or diverges from it will be visible in the coming months of regional labor data.
The tourist development tax question
Tourist development tax revenue, levied on short-term lodging, funds a defined set of purposes under Florida statute. Orange County's collections are among the largest in the state and support the Orange County Convention Center, destination marketing through Visit Orlando, and other statutorily permitted uses.
Because those revenues are pledged in some cases to debt service on capital facilities, a sustained decline in lodging demand has fiscal consequences that extend beyond the operating budget. County governments in tourism-dependent jurisdictions monitor these collections closely as a leading economic indicator.
The relationship is not one to one. Tourist development tax revenue tracks lodging revenue rather than attendance, so a market where visitors stay the same number of nights at higher room rates can produce stable collections even with fewer visitors.
Local impact across the state
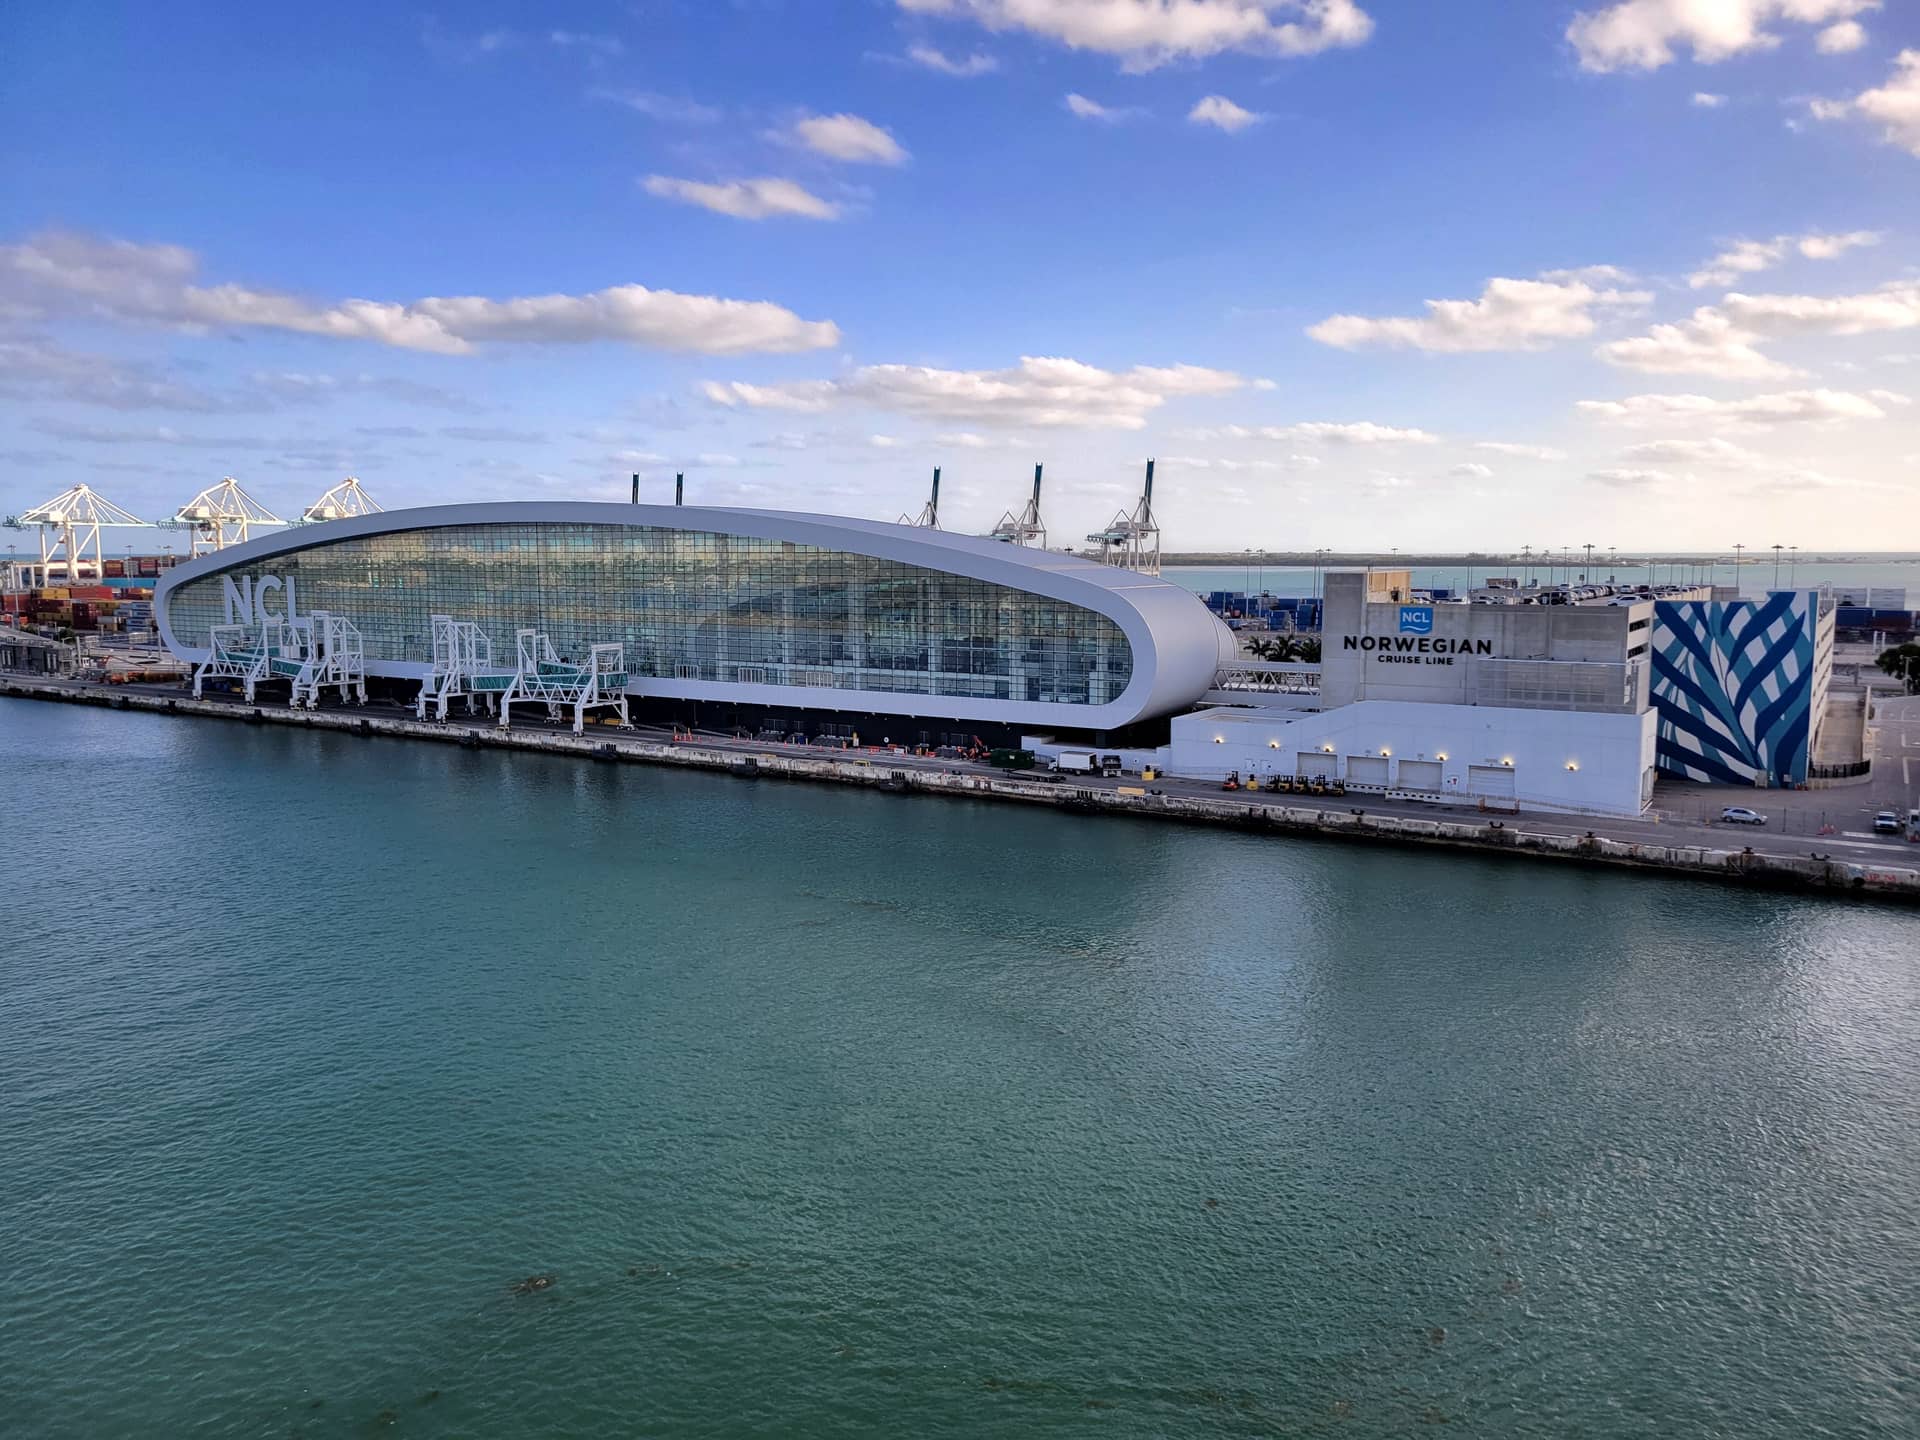
Central Florida is the epicenter, but the tourism economy extends well beyond it. Tampa Bay hosts Busch Gardens and draws beach visitation to Pinellas County. Miami-Dade and Broward combine beach tourism with the cruise industry operating out of PortMiami and Port Everglades. The Space Coast combines beaches with launch viewing and Port Canaveral cruise traffic.
Those markets have different demand drivers. Cruise bookings, for instance, have shown resilience distinct from theme park attendance, and Port Canaveral is in the middle of a $93 million parking garage expansion at Cruise Terminal 6 that reflects operator confidence in sustained volume.
Northeast Florida and the Panhandle draw more heavily on drive-market visitation from Georgia, Alabama and the Southeast, which behaves differently from the fly-market visitation Orlando depends on. Drive markets tend to hold up better when air travel costs rise.
What it means for Florida visitors
For families planning trips, a softer market generally means better availability and more aggressive promotional pricing. Operators facing attendance pressure typically respond with resident ticket offers, multi-day discounts, room and ticket packages and dining promotions rather than list price reductions.
Florida residents in particular tend to benefit, since resident-only offers are a standard tool for filling capacity during slow periods without repricing the national market.
Crowd levels at the parks themselves are the other practical implication, and lower attendance translates directly into shorter waits, which is the single variable most guests cite as determining the quality of a park visit.
What capacity expansion did to the market
The Orlando destination added substantial capacity in 2025 with the opening of Epic Universe, and the effects of that addition are still working through the market.
Theme park economics reward capacity expansion when demand is growing and punish it when demand is flat. A destination that adds a major park draws additional visitation if the new attraction expands the total market, and redistributes existing visitation if it does not. The difference determines whether every operator benefits or whether the addition is zero sum.
Universal's position has been that Epic Universe is delivering the guest response the company expected and is increasing per-capita spending across the destination. Per-capita spending is the metric that matters most when attendance is flat, because revenue can hold or grow on higher spending per visitor even as headcount declines.
Disney has characterized its own attendance as strong. Both operators have incentives to present their results favorably, which is why the market-level statement from Comcast about broad softening carries more analytical weight than either company's characterization of its own performance.
Length of stay is the variable that connects the two. A destination with more parks can support longer visits, which raises total spending per trip even when the number of trips declines.
The cost of an Orlando vacation
The affordability question that operators cited deserves specificity, because the total cost of an Orlando trip has risen through multiple components simultaneously.
Multi-day admission pricing has increased steadily over the past decade, and the addition of paid line-skipping products has changed the effective cost of a visit for guests who purchase them. Those products are optional, but the queue experience for guests who decline them has changed as a result.
On-property lodging pricing has followed a similar path, and the growth of the vacation rental market around the destination has provided an alternative that reshapes where visitors stay.
Airfare and rental car costs have been volatile, and both are outside the operators' control. Orlando International Airport is among the busiest in the country, and the drive market extending through Georgia, Alabama and the Carolinas provides an alternative for households who find flying too expensive.
In-park food and merchandise complete the picture. Those categories are where per-capita spending gains have concentrated, and where guests report the sharpest sensitivity to price increases.
The workforce behind the industry
Central Florida's tourism industry employs tens of thousands of workers across attractions, hotels, restaurants and transportation, and the industry is the region's economic foundation in a way few American metropolitan areas match.
Wages in leisure and hospitality run below the Florida median, which itself runs below the national median. That produces a persistent affordability challenge for the workforce in a region where housing costs have risen substantially, and workforce housing has become a recurring policy question for Orange and Osceola county governments.
Union representation is present in portions of the workforce, and contract negotiations at the major operators have produced wage increases in recent years.
The seasonal and part-time composition of the workforce means that hours reductions, rather than layoffs, are typically the first response to softening demand. Workers experience that as reduced income without appearing in unemployment statistics, which is why the headline unemployment rate can hold steady while household conditions deteriorate.
Florida's statewide unemployment rate held at 3.7 percent in July, below the national rate of 4.2 percent, with private-sector employment adding 5,700 jobs.
What's next
The next set of hard data points will come through third-quarter earnings reports from Comcast and Disney, which will cover the summer season in full and will show whether June and July weakness continued through August.
The fall shoulder season and the holiday period will be the more meaningful test. Orlando's calendar concentrates demand around Thanksgiving and the weeks between Christmas and New Year, and booking pace for those periods is the metric operators watch most closely.
Regional employment data for Orange and Osceola counties will show whether the attendance trend has moved through to payrolls, which is the point at which a tourism slowdown becomes a broader economic story for Central Florida.
Spotted an issue with this article?
Have something to say about this story?
Write a letter to the editor